
Developing a Performance Tracking Dashboard for Manufacturers
the Objective
Create a detailed performance tracking dashboard to help manufacturers on Xometry gain insights into their overall performance, with a specific focus on identifying quality and timeliness rejections.
The goal was to provide granular, time-over-time data and job-specific breakdowns to help manufacturers fully understand performance trends, pinpoint issues, and drive improvement.
Deliverables
Clear problem statement based on user needs and business goals.
Defined KPIs for dashboard success (e.g., user engagement, improvement in quality scores).
Documentation of existing system shortcomings and improvement opportunities.
the Ideation
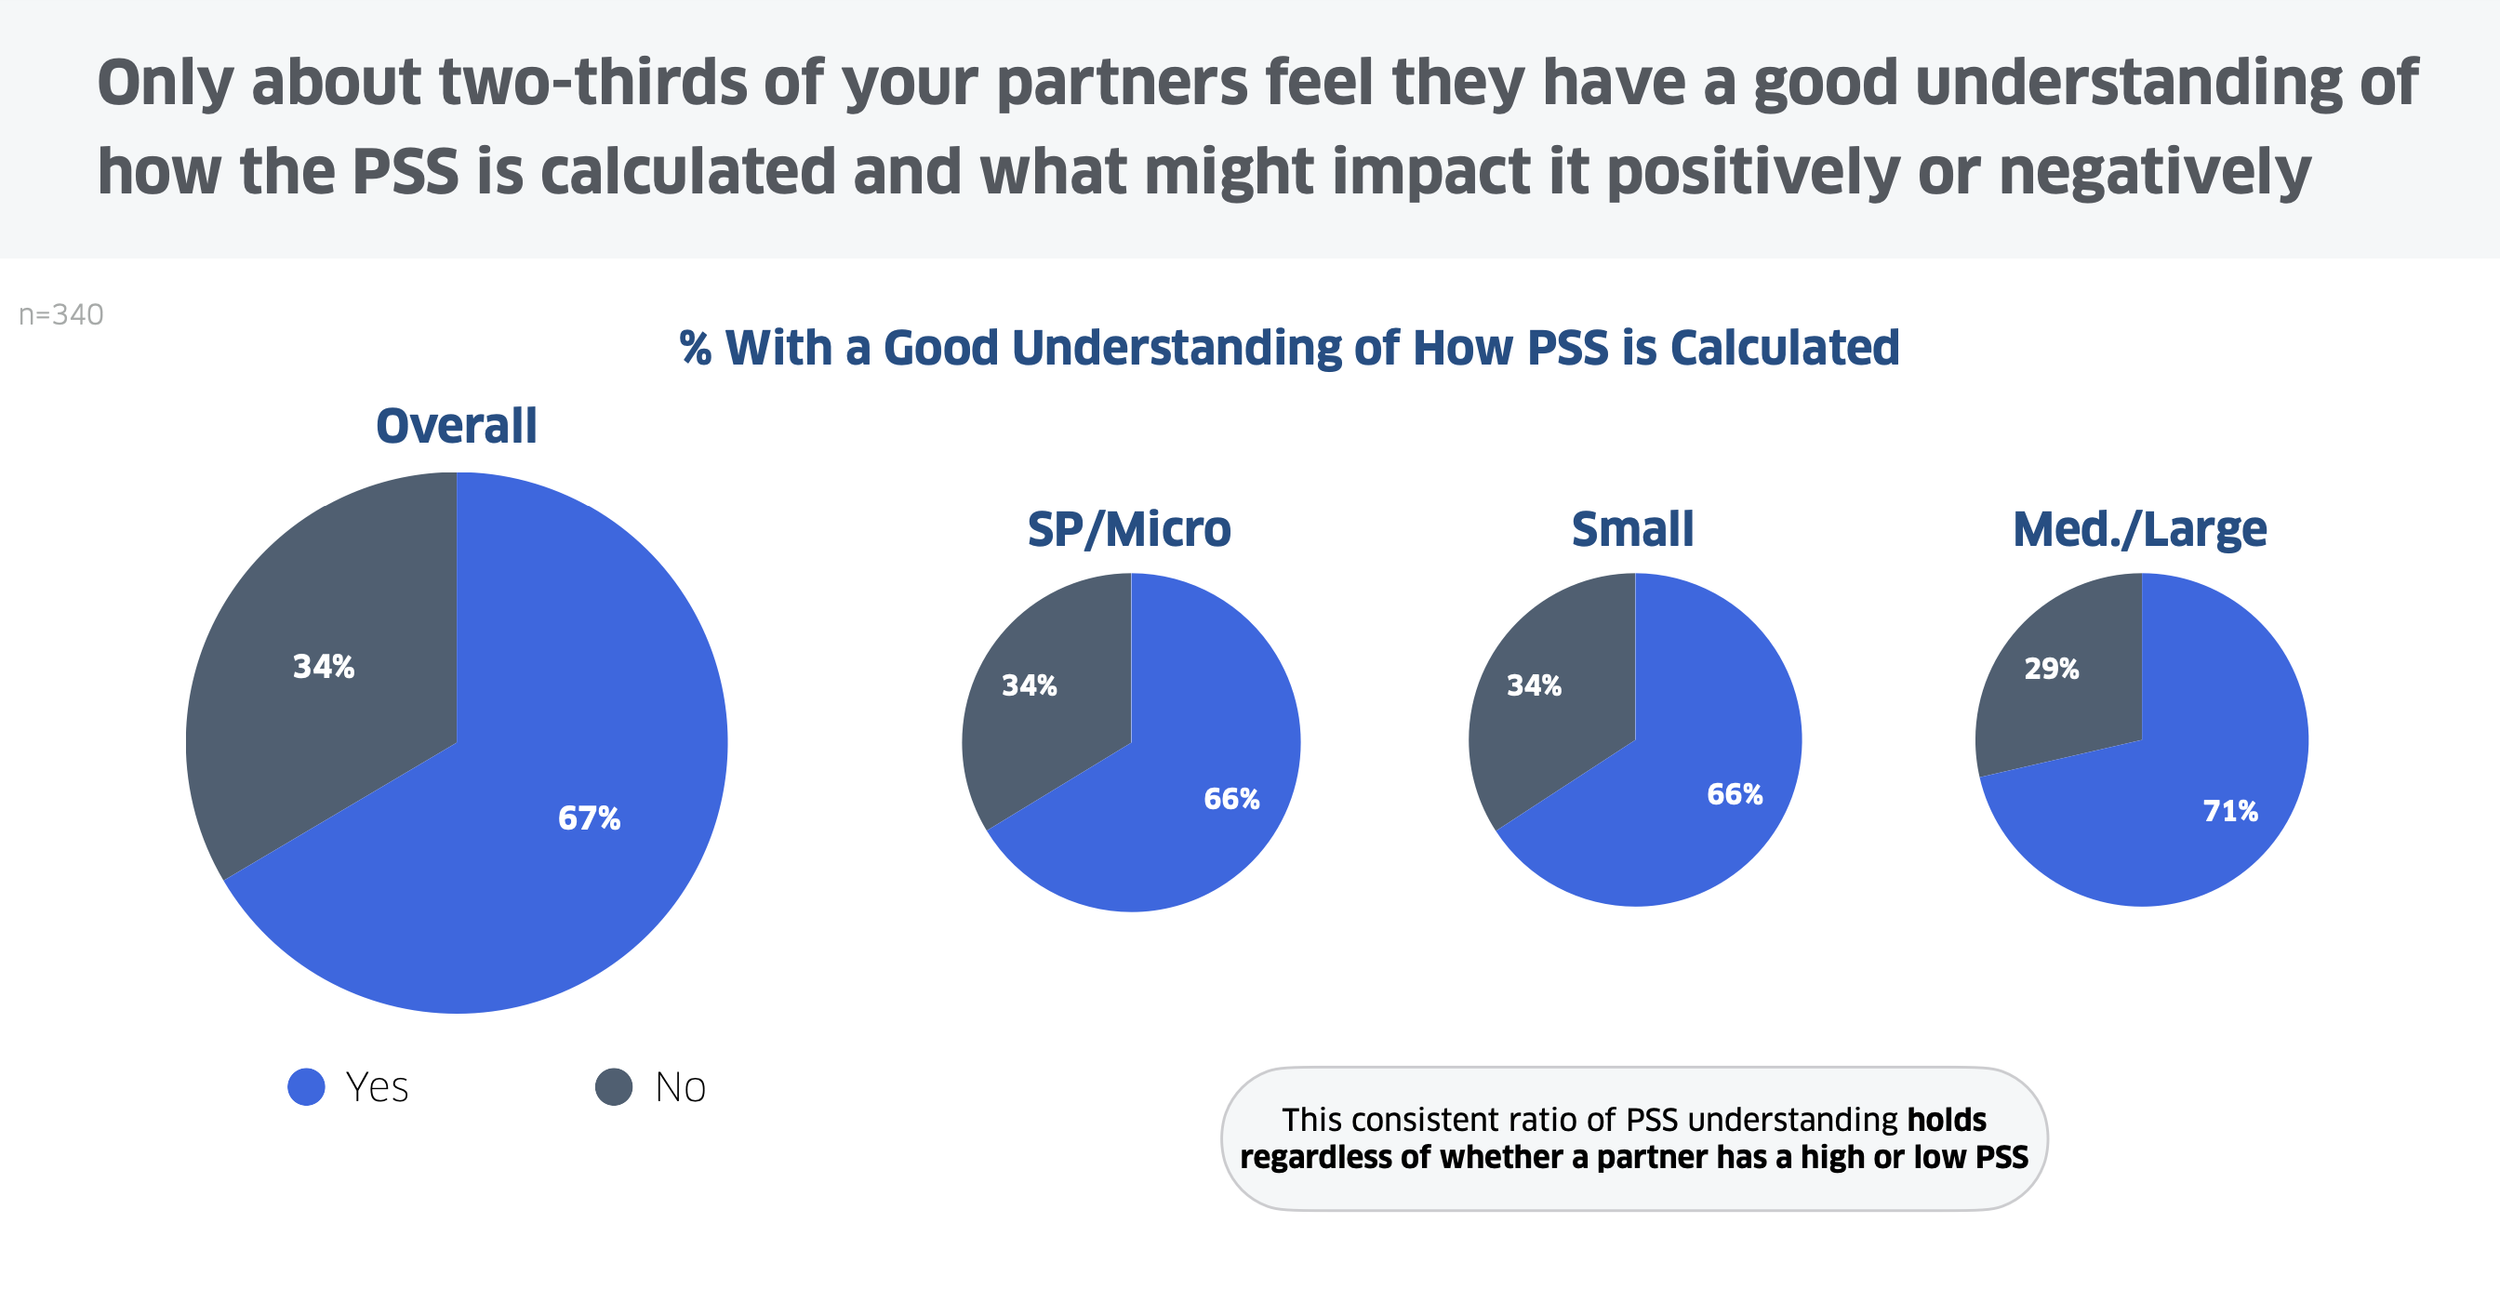
Through user research and interviews, manufacturers highlighted a need for greater transparency and actionable feedback in their performance tracking. While a dashboard previously existed, it lacked the depth and specificity required to understand the root causes of performance issues.
These insights informed the ideation process, leading to the design of a solution that would provide manufacturers with clearer, more detailed visibility into their performance metrics.
Deliverables
User interview insights synthesizing key pain points and feature requests.
Low-fidelity wireframes of potential dashboard layouts.
Competitive analysis of similar tools to identify usability gaps.

the Creation
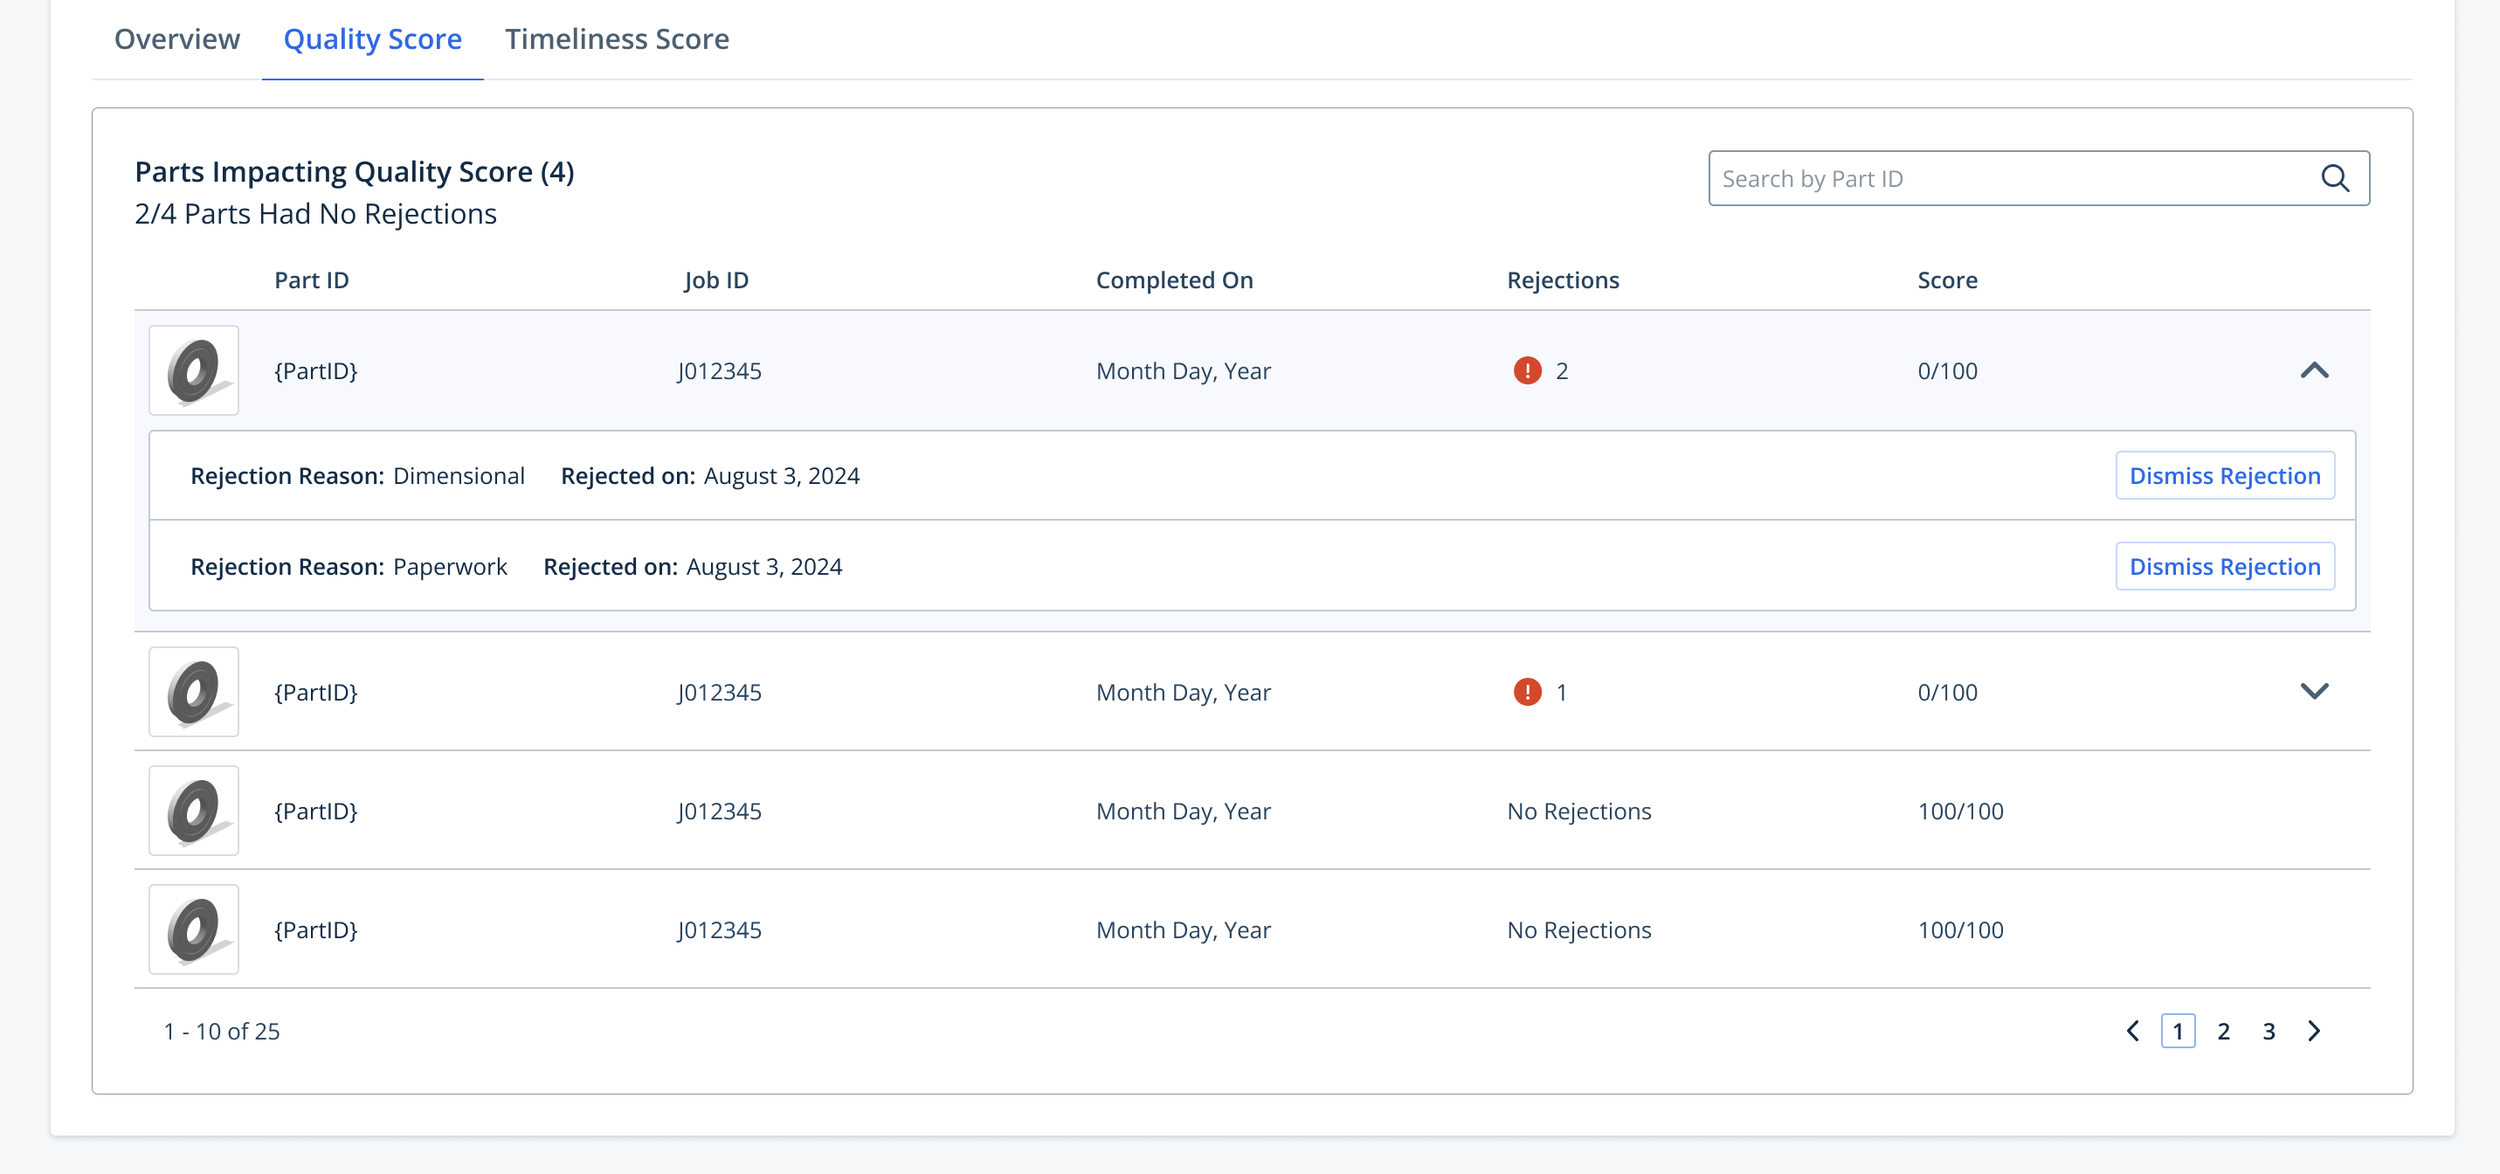
I designed the dashboard to serve as a centralized hub for all performance-related data, incorporating detailed visualizations of time-over-time trends, job-specific scores, and their impact on overall performance.
Each element was thoughtfully crafted to ensure manufacturers could easily interpret the data, understand how specific issues contributed to their overall score, and identify clear areas for improvement. Collaborative feedback sessions with users refined the design to ensure it addressed their needs effectively.
Deliverables
High-fidelity prototypes showcasing detailed charts, graphs, and data visualizations.
User flows demonstrating how manufacturers interact with the dashboard.
Usability testing results leading to iterative design improvements.

the outcomes
The new dashboard delivered a significant improvement in usability and data clarity for manufacturers. By providing granular performance details and actionable insights, it empowered manufacturers to better understand their performance metrics and implement targeted improvements.
Early feedback indicated that manufacturers felt more confident in managing their quality and timeliness, and Xometry saw a noticeable reduction in support inquiries related to performance issues.
Deliverables
Increased manufacturer engagement with performance data, with more users regularly reviewing their scores and trends.
Reduction in support requests related to unclear performance scoring, as manufacturers could now self-diagnose issues more easily.
Positive user feedback on the ability to track quality and timeliness over time, helping manufacturers make informed improvements.
